The past few weeks have seen a massive increase in interest in mobile phone surveys as researchers and operational teams aim to better understand the various impacts of the COVID-19 pandemic. While the scale of this pandemic is unique, past experience with rapid response surveys in response to Ebola outbreaks in Sierra Leone and Liberia, coupled with lessons from mobile phone surveys in many developing countries during non-crisis periods offer some lessons and guidance. This is the first post of a two-part series of blog posts written with colleagues from RTI International (Stephanie Eckman, Charles Lau) who have conducted many mobile phone surveys and published peer-reviewed journal articles on methodology and best practices for this method. We should also note that the guidance we have here will necessarily be incomplete, and we refer readers also to the excellent living document on phone surveys from J-PAL; and to this World Bank Practical Guide for Mobile Phone Surveys in Developing Countries for additional content.
Today’s first post looks at various rationales for starting new data collection, discusses different sampling strategies and how samples can be made more representative, and discusses the three main modes of completing these surveys and their costs. The second part tomorrow will cover aspects around getting people to respond, improving the accuracy of responses, and questionnaire design.
The reason you are doing a COVID-19 survey will affect what sampling strategy you need
The reasons researchers or operational staff may want to conduct data collection right now can be divided into three broad categories:
1. As a follow-up on an existing baseline survey or impact evaluation: This issue was discussed in two of our recent posts (post 1, post 2). Here researchers have an existing sample frame, hopefully with phone contact information, and now want to follow-up to see whether the intervention affected responses during the COVID-19 pandemic; or may want to measure other outcomes, COVID-related or otherwise, and capitalizing on an existing survey is the best way to do so. Key advantages here are that there is usually a lot of baseline information on individuals or firms, along with some pre-existing relationship through past surveying that may increase response rates.
2. As a baseline for a new impact evaluation: The idea here might be to test different ways of getting people to change their behavior (e.g. to social distance) or the efficacy of some potential policy responses. It may be less important to get a representative sample here (subject to external validity debates) and the goal may just be to achieve a large enough sample size to inform the launch of an intervention.
3. Rapid-monitoring surveys of household or firm impacts: Here the goal may be to take the “pulse” of households or firms, in order to measure how COVID-19 is affecting them, what their knowledge and expectations are about the crisis, and to inform or measure policy responses. For many of these purposes the goal will be to get a representative sample of the population, or at least of a well-defined sub-population (e.g. of households in a poverty program, or of firms in certain industries or size categories). In many cases the goal may also be to track respondents over multiple waves to measure how these responses change.
In all cases we urge people planning surveys to carefully consider what the rationale is and whether there is global knowledge or actionable policy actions coming from it. As Tim Ogden wrote in his Friday FAIV last week “The impulse to pivot or start new work to measure impact is understandable but I worry that what we are going to see is a lot of not great surveys telling us that things are bad. I'm not sure what the policy-relevance of that data is going to be. The important questions start with: what is a plausible and possible policy response, and what information is needed to inform that response?” – the rest of our post will try and help make sure your methodology at least is as good as possible.
How do you create a sample frame for a mobile phone survey?
There are three main approaches to constructing a sampling frame for phone surveys:
(1) Sampling from respondents of a baseline (usually face-to-face) survey that had a representative frame and a high response rate
Example: High-frequency phone surveys conducted by the World Bank during the Ebola crisis in Liberia and Sierra Leone used samples previously interviewed in the household income and expenditure surveys and labor force surveys. Of course, this only covers those who provide phone numbers – 43% of the households in Liberia and 34% in Sierra Leone did not have mobile numbers for any household member.
Key issues to consider: Maximum sample size is constrained by the size of the baseline survey; the survey needs to be recent, or else phone numbers may no longer be valid. In some countries, respondents change phone numbers frequently to take account of special offers. For example, an IVR survey in Liberia reports that six months after the selection and screening process, an NGO found that, of all 1,460 phone numbers provided, 43% (634) of the numbers were permanently switched off and 28% (408) were not ringing. A key advantage is being able to use baseline information to characterize how responders differ from non-responders, which can be used for reweighting.
(2) Obtaining a list of valid phone numbers from a telecom company or private firm
Example: SMS surveys in Africa, based on random samples from GeoPoll, a firm that has access to subscriber lists from mobile network operators
Key issues to consider: These lists often need to be purchased or negotiated, which can be time-consuming in a rapid response situation; the lists may not represent the entire population. For example, if there are 2 telecom companies in a country, and only one is willing to provide data for a study, everyone who uses the other company is not represented (see example from SMS surveys in Africa). For firm surveys, market-research firms may have existing lists of firms that could be used, though these lists likely contain relatively few variables that can be used to compare responders to non-responders.
(3) Using Random Digit Dialing (RDD)
Example: Interactive voice response (IVR) and SMS surveys on noncommunicable diseases, as part of a project to strengthen the capacity of Ministries of Health for mobile phone surveys
Key issues to consider: Sample size can be as large as you want to make it, but this method can also be inefficient, since many generated numbers will be unassigned or non-working, and you will often not be able to tell in advance whether a number belongs to a household or a firm. For example, 214,823 RDD calls were used in an Ebola survey in Liberia, with only 24,000 of the numbers connecting; while in Ghana over 1 million RDD numbers were needed to get 16,003 connections (1.5%). A key disadvantage is not having other information available to use for weighting or understanding non-responders.
In all cases, a mobile phone survey is at most going to be representative of the population that has a working phone (or that you can at least potentially reach through the phone of someone nearby). The proportion without a phone is decreasing around the world, but 30% of the world’s population still lack access to a mobile phone. There is an important gender gap in mobile phone ownership in many countries: in sub-Saharan Africa 74% of adult women own phones compared to 85% of adult men. Phone ownership is also lower in rural areas, which can be additionally exacerbated by pockets where mobile phone coverage is spotty or non-existent. For example, in the baseline survey for an ongoing evaluation of migration from rural Gambia that David is doing, only 37% of respondents say that mobile phones work most or all of the time in their village. General population mobile phone surveys tend to over-represent young, male, urban, and educated people, research in Nigeria and Ghana shows. An additional point to note for COVID-19 rapid response surveys is that it might be precisely some of the people most affected who are no longer reachable by phone – firms which close down may not be reachable at their business phones, while individuals who lose their jobs and income may not top up their phone credit.
How can I make my sample more representative?
Representativeness will depend on the overall non-response rate, which individual ultimately responds to the survey, and what adjustments you make to the data afterwards. We will discuss how to get people to respond to surveys, conditional on them being in the sample frame, in our next post. But here we note two approaches that can potentially help representativeness:
1. Attempt to overcome within household differences in ownership by asking to speak to a randomly chosen adult: If your outcomes are household-level outcomes, then you may be ok with just talking to the household head. But if you want to understand the knowledge, labor force reactions, health, or other behaviors of individuals, you could consider mitigating the bias in phone ownership by asking to speak to the adult in the household with the next birthday, or if you have a pre-existing list, randomly choosing someone from the household roster to interview. While this approach was common in landline surveys in the United States (dating back to the 1960s) it is relatively rare with mobile phone surveys and may be difficult to implement in the developing world. A related effort to undo mobile phone ownership differences in non-crisis times has been to give phones to individuals without them during a face-to-face baseline. This is unlikely to be possible in rapid response survey efforts.
2. Reweight the data afterwards: Weighting adjustments can reduce bias due to nonresponse and lack of representation. Two techniques are common. The first uses only sample information and inflates weights by the inverse of the response rate or the predicted probability of response. The second adjusts weights to match known population totals. These techniques can be used separately or together, depending on the data available. Adjustments will increase the variability of the weights, however, which increases the standard error of survey estimates. For example, in the Liberia survey, a female household head working in agriculture in rural Nimba county has a weight one hundred times larger than the weight of a male wage employee in urban Grand Gedeh. Moreover, the short questionnaire length of phone surveys typically means that unless you already have a lot of baseline data, the number of variables you can use to do this reweighting will be limited.
How Should I Conduct the Survey? Mobile Phone Modes
There are three main mobile phone modes for low- and middle-income country research:
1. computer-assisted telephone interviewing (CATI), which consists of interviewer-administered phone surveys
2. interactive voice response (IVR) surveys, automated voice surveys
3. short message service (SMS) surveys that use text messaging.
(A fourth approach is web surveys completed by mobile device, which may work for some surveys of entrepreneurs and firms, but since they require smartphones, are typically out of reach of many poor households.)
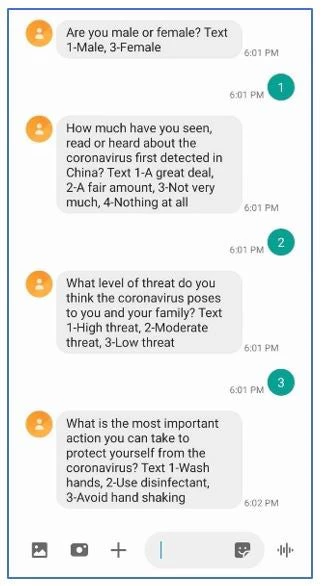
An example of an SMS survey
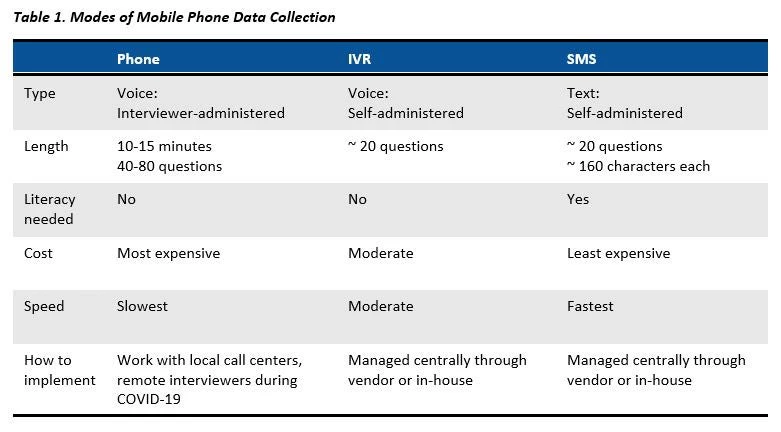
The three mobile phone survey modes have strengths and weaknesses. Table 1 summarizes the differences among them. Traditionally, CATI surveys use a centralized call center, which is not feasible during a pandemic. As of early April 2020, centers around the world were transitioning to virtual call centers, where interviewers call from home. However, these virtual call centers are new and questions remain about quality control and volume. J-PAL recently published useful guidance about how to transition to virtual call centers. IVR and SMS are feasible during the pandemic because they can be managed through the internet and do not involve any person-to-person contact.
However, there is no need to be constrained to just one mode – studies that combine modes can benefit from each mode’s strengths. The most common approach is a sequential mixed-mode design, where respondents are contacted in one mode; those that do not respond are contacted in a different mode. Research from South Africa shows that this strategy can improve response rates and data quality. Other mixed mode options include concurrent mixed mode (where respondents are offered a choice), reminders in a different mode, or a longitudinal survey (i.e., starting in CATI then moving to SMS.)
Which approach is better? As with everything in economics, it depends. CATI offers a more expensive but more powerful approach to collect larger numbers of questions. SMS can deploy quickly and at a low cost, but it is limited in the number and complexity of questions possible for both analysis and reweighting (more in tomorrow’s post). IVR lies somewhere in the middle. Unfortunately, there is no one-size-fits-all approach and analysts should carefully review objectives and budgets in planning data collection.
How much do Phone Surveys Cost?
Costs will vary according to the cost of labor (interviewer salaries), cost of phone time, whether you are giving incentives (see tomorrow’s post), survey length, number of call attempts, and survey mode. It would be good to consistently collect costs for these new COVID-19 surveys being planned, noting that costs may be higher in rapid response situations. But as a starting point, here are some examples of costs provided in the literature for phone and IVR surveys:
· Ghana 2017: $4.50 per case for a 10-minute CATI survey.
· Nigeria 2017: IVR survey is approximately double the cost of an SMS survey.
· Liberia 2015: $1.63 per completed IVR survey, and $22.45 per complete CATI phone survey.
· Malawi 2015: $5.80 to $8.80 per CATI survey for a 42-question survey.
· South Africa 2014: $4.76 per completed microenterprise phone survey cost.
How many interviews can get done per day?
· Mobile phone surveys conducted in Madagascar, Malawi, Senegal, Tanzania and Togo found in their experience call interviewers can complete between 10 and 15 interviews successfully per day, but that productivity is normally much higher to begin with, while the last respondents are more difficult and call volumes drop as a result. Longer surveys will of course result in fewer surveys per day. Productivity will likely be lower during the COVID-19 pandemic because of limited staff and internet bandwidth limitations of virtual call centers. Surveys with business owners typically have lower numbers of completed interviews per day, due to requests to call back or re-schedule to a time when business isn’t operating (obviously this may differ if the business is temporarily closed for COVID-19 reasons). Numbers per day can obviously be much higher for SMS and IVR interviews, since they do not depend on a human interviewer. In Charles’ experience, it is possible to complete several thousand SMS surveys in as little as three days.
Stay tuned for tomorrow’s second part, where we explore how to get people to respond to surveys, discuss phone survey response rates, offer tips on ensuring and checking the quality of responses, and finish with some discussion of questionnaire design.


Join the Conversation